This page is a how to use Observium. For machine documentation, please see observium.club.cc.cmu.edu. For more information on how SNMP is configured please see Services/Club SNMP
Contents
What is this?
Observium is a Machine/Switch/Filer CPU/RAM/Disk/Application monitoring system that uses SNMP to discover features and poll each host. This requires snmpd to be running on each monitored host.
1. Adding clients to Observium
Make sure Packages are working on the client then as root run the following script on the client.
/afs/club/system/scripts/sh/snmp-configure-monitoring.sh
If the script fails at the adding host step (ssh rsync@observium.club.cc.cmu.edu). Try manually adding the host at https://observium.club.cc.cmu.edu/addhost/
To setup the Observium server please see observium.club.cc.cmu.edu.
2. Observium Web Interface
Goto https://observium.club.cc.cmu.edu for the web interface.
Choose 1. Menu bar > Health > Disk/CPU/Memory to get an overview of the room.
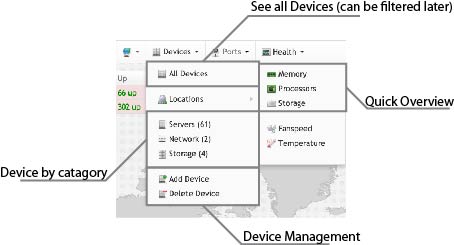
Choose 1. Menu bar > Devices > All devices to see all devices.
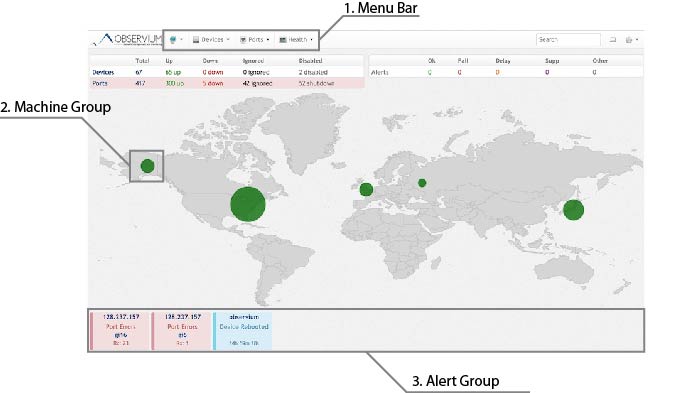
Here's the main screen:

2.1. Menu Bar
The Menu Bar will allow you to get a quick detailed overview of the room as well as a detailed information of each host.

2.1.1. Health
The Heath section allows you to see Memory/CPU Load/Disk of all Hosts in a single page.
You can toggle between small graphs/large graphs by clicking Graph/No Graph on the top right.
2.1.2. Devices
The devices section allows you to drill down which devices to examine. You can choose to filter by Devices type or Location. As we are not actually using real locations this won't be that helpful. The sections are divided as follows:
- Network: Switchium and switch2
- Load Balancers: lb-1,lb-2
- Storage: Netapp Filers, and Storage (Where actual disks matter)
- Workstation: Shells and Carbon
- Servers: Everything else
You can further narrow down devices by filtering from the search menu.
2.2. Device Map
We plan to group each device by Rack and Dom0. Each dot will indicate a DomU-Dom0 group and each continent will indicate each rack as follow:
- North America: Rack 0 + Misc
- South America: Rack 1
- Europe: Rack 2
- Africa: Rack 3
- North Asia: Rack 4
- South-East Asia: Rack 5
- Oceania: Rack 6
2.3. Notification Section
Here Devices being down and rebooted as well as ports (which may be connected to unmonitored devices) are displayed. These alerts may correspond to alerts sent out by the alerting mechanism too.
Here are some critical alerts:
Device Down: Indicates a problem contacting the SNMP agent on the host. This may be due to the device actually being down or the SNMP agent freezing/crashing. SNMP agent freezing can occur due to storage-2 being down
Port Down: Indicates that the switch detected the nic on the other side went down. This can indicate that the host is actually unreachable.
Here are some usually safe alerts:
- Port Errors: Usually safe to ignore. Indicates a problems with the client nic, usually on a retro device (gi 16, gi 6).
- Device Rebooted: Usually safe to ignore, Auto dismisses after a set time. Indicates that the client has rebooted recently.