This article is about the Observium Software System. For the machine with the same name , please see observium.club.cc.cmu.edu. For more information on SNMP, please see Services/Club SNMP.
Observium is a Machine/Switch/Filer CPU/RAM/Disk/Application monitoring system that uses SNMP to discover features and poll each host. This requires snmpd to be running on each monitored host.
Contents
1. TODO
- Add the workstations and shells
Finish Writing the wiki for observium.club.cc.cmu.edu, observium-proxy.club.cc.cmu.edu,and Services/Club SNMP
- Move Machines to the correct Dom0 Continent
Write a module for weather.club.cc.cmu.edu as mibs can be obtained from https://weather.club.cc.cmu.edu/mib.zip and example modules can be found in the modules directory
- Add Application specific monitoring (Apache/Mysql/Postgres)
2. Adding clients to Observium
Make sure Packages are working on the client then as root run the following script on the client.
/afs/club/system/scripts/sh/snmp-configure-monitoring.sh
If the script fails at the adding host step (ssh rsync@observium.club.cc.cmu.edu). Try manually adding the host at https://observium.club.cc.cmu.edu/addhost/
To setup the Observium server please see observium.club.cc.cmu.edu.
3. Observium Web Interface
Goto https://observium.club.cc.cmu.edu for the web interface. You'll need a club account.
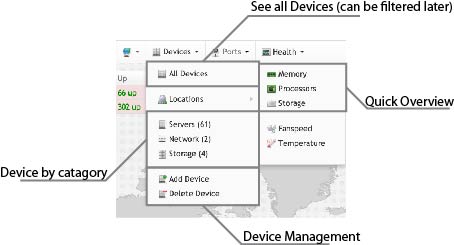
Choose 1. Menu bar > Health > Disk/CPU/Memory to get an overview of the room.
Choose 1. Menu bar > Devices > All devices to see all devices.
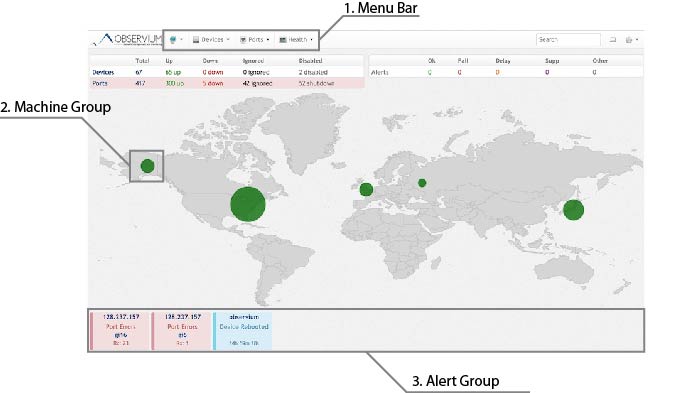
Here's the main screen:

3.1. Menu Bar
The Menu Bar will allow you to get a quick detailed overview of the room as well as a detailed information of each host.

3.1.1. Health
The Heath section allows you to see Memory/CPU Load/Disk of all Hosts in a single page.

You can toggle between small graphs/large graphs by clicking Graph/No Graph on the top right.
3.1.2. Devices
The devices section allows you to drill down which devices to examine. You can choose to filter by Devices type or Location. As we are not actually using real locations this won't be that helpful. The sections are divided as follows:
- Network: Switchium and switch2
- Load Balancers: lb-1,lb-2
- Storage: Netapp Filers, and Storage (Where actual disks matter)
- Workstation: Shells and Carbon
- Servers: Everything else
You can further narrow down devices by filtering from the search menu.

Search showing all host running Debian 4.0
3.2. Device Map
We plan to group each device by Rack and Dom0. Each dot will indicate a DomU-Dom0 group and each continent will indicate each rack as follow:
- North America: Rack 0 + Misc
- South America: Rack 1
- Europe: Rack 2
- Africa: Rack 3
- North Asia: Rack 4
- South-East Asia: Rack 5
- Oceania: Rack 6
3.3. Notification Section
Here Devices being down and rebooted as well as ports (which may be connected to unmonitored devices) are displayed. These alerts may correspond to alerts sent out by the alerting mechanism too.
Here are some critical alerts:
Device Down: Indicates a problem contacting the SNMP agent on the host. This may be due to the device actually being down or the SNMP agent freezing/crashing. SNMP agent freezing can occur due to storage-2 being down
Port Down: Indicates that the switch detected the nic on the other side went down. This can indicate that the host is actually unreachable.
Here are some usually safe alerts:
- Port Errors: Usually safe to ignore. Indicates a problems with the client nic, usually on a retro device (gi 16, gi 6).
- Device Rebooted: Usually safe to ignore, Auto dismisses after a set time. Indicates that the client has rebooted recently.
3.4. Live Monitoring
Observium allows live monitoring of network traffic, this can be done through the Host Page > Ports > port > Real Time (Note the menu may require scrolling down).
An interesting port to monitor is the uplink port Real Time Uplink port
4. Configuring Observium
This section is a stub. You can help by Computer Club Wiki by expanding it
4.1. From the Web interface
Click around the Edit (gear) icon on the right, most settings can be found that way
The Enabled Modules for each host can be found in (With admin permissions) Host Page > Edit (Gear) > Modules
Most machine have
================
Ports : ..
Processors :  hrDevice
Memory : hrStorage
IPv4 Addresses : ..
IPv6 Addresses : .
Storage : hrStorage : ....
hrDevice : ....
UCD Disk IO : .....
4.2. Through config.php
!!!WARNING: The config.php file at observium.club.cc.cmu.edu and observium-proxy.club.cc.cmu.edu must be IDENTICAL. There is no auto-sync!!!
The statement above doesn't apply if you know what you are doing. I imagine that they may differ when setting site-gui specific options, or alerts settings. But in general it's safest to just make them identical.
The config file lives at /opt/observium/config.php defines the site configuration. Default values for this configuration can be found at /opt/observium/includes/defaults.inc.php
I have added two non-standard configuration options as follows:
$config['rrdtool_socket_host'] = "observium.club.cc.cmu.edu";
$config['rrdtool_socket_port'] = "13900";
Make sure that these are set for the rrdtool system to work correctly.
5. System Layout and Performance Considerations
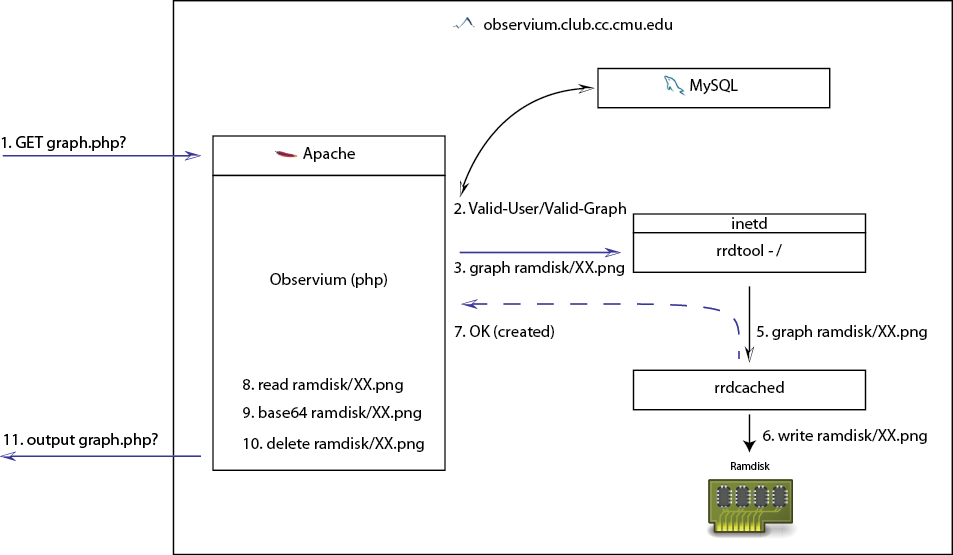
The following image shows the relevant software and services on the two host.

Here you see that MySQL is installed on observium.club.cc.cmu.edu and has been configured to allow connections from observium-proxy.club.cc.cmu.edu. Also on both hosts, sshd is running and observium.club.cc.cmu.edu will accept connections from observium-proxy.club.cc.cmu.edu using the rsync key. (using ssh here is debatable. Anyone with a better system please change it).
Also important to note here that on observium.club.cc.cmu.edu inetd is running rrdtool as a service at port `13900. This will be important in the polling and graphing step.
5.1. Non-Standard behavior disclaimer
I would like to note here that the behavior that will be described is different than what you would get from Any other observium installation. Specifically the polling mechanism and parts of the graphing mechanism. I have included here the modified /opt/observium/includes/rrdtool.inc.php /opt/observium/includes/polling/functions.inc.php
The rrdtool.inc.php file has modifications pretty much in every function to allow correct waiting behavior from a socket. As well as special modification in rrdtool_create to actually check if a remote file exist before creation.
The functions.inc.php file has modification only on line 211 to check the existence of the remote directory and ssh if doesn't exist.
5.2. Polling Mechanics
Observium utilizes SNMP to query each host. This requires each poller to iterate through each Enabled Modules each time each host is polled.
Observium must(As of this) have the poller run every 5 minutes. The poller is initiated via a cron script, usually located in /etc/cron.d, and the number of instance launched is controlled by the number after /opt/observium/poller-wrapper.py #. This scheduler does not care if the previous poll run is still running, so it is important to make sure the poll finishes before the next run starts. Polling statistics can be found in the poller log: https://observium.club.cc.cmu.edu/pollerlog/

5.3. RRD Graph System

5.4. The proxy poller
Needs cleanup
observium-proxy.club.cc.cmu.edu has 8 VCPU. I've set poller-wrapper.py 8 to allow 8 threads at a time, this seems to give the best performance at the cost of 100% utilizing the CPU. The poller still completes in 3m46.602s, with minimal Modules Enabled, thus is within the 5minutes mark.
In a single host, this would have left no room for the RRDTool or apache to run during a poll. Thus why observium-proxy exist.
5.5. Future Optimization Consideration
multi host polling
6. Upgrading Observium
Occasionally observium releases new updates at http://observium.org/. Good thing they released one before I left, this process requires a human operator.
observium disable all observium cron jobs in /etc/cron.d/observium
observium cd into /opt and move /opt/observium to /opt/observium-<old-version>
observium remove/backup observium-community-latest.tar.gz
observium wget http://www.observium.org/observium-community-latest.tar.gz; tar zxvf observium-community-latest.tar.gz;
observium copy ./observium/config.inc.php to ./observium/config.php
observium look at ./observium-<old-version>/config.php, ./observium/includes/default.inc.php and copy the required settings over to ./observium/config.php. Things that might have changed between version are the polling settings or some of the configs.
I don't think we need this anymore: observium look at ./observium/includes/polling/functions.inc.php and find mkdir. look at ./observium-<old-version>/includes/polling/functions.inc.php and find ssh make sure these will merge correctly. The point of this is so that if a directory for a machine doesn't exist, it'll be created.
I don't think we need this anymore: observium look at /opt/observium/includes/rrdtool.inc.php and /opt/observium-<old-version>/includes/rrdtool.inc.php. Merge old version into new version as appropriate.
observium move /opt/observium-<old-version>/rrd to /opt/observium/rrd
observium run php includes/update/update.php
observium run /opt/observium/discovery.php -h none
observium modify /opt/observium/html/.htaccess, add reply to the exclude line (see the old version one for reference)
observium Test https://observium.club.cc.cmu.edu
observium re-enable cron